Collaboration with AMTIL

In his ‘Opinion’ piece in December AMT, the magazine for all the AMTIL members and really anyone who has a passion for manufacturing and technology, the CEO Shane Infanti uses the ubiquitous coffee bean to explain how machine tools are the “Mother of all products”. Machine Tools helped produce the whole machinery set involved in delivering coffee from plant to the cup. And these machines and processes are being increasingly automated. I can vouch for this personally as some coffee aficionados I know used to hand grind their own beans – the only way – but they have even moved to the latest automatic grinder! My reference to this move into automation is exactly the point that Shane makes; we are accelerating into a totally automated world and machine tools, in their many forms of innovation and advancement will continue to underpin this automation. This is the first message in Shane’s piece – that our manufacturing companies “need to continually invest in manufacturing technology if we are to call ourselves an advanced manufacturing industry”.

He then makes another important point to all AMT readers about rejuvenation in this accelerating world of change that is very pertinent to Vernier. It was Tom Peters book in the 1990’s that first introduced me to the statement “If it is not broke – break it!”. In other words, change and adaptation need to be an essential part of business planning today. This is why, I assume, Shane has shared the AMTIL Board’s revised Vision and Mission statements. It was the last part of AMTIL’s mission that resonated with me “ensuring advanced manufacturers [although I think it should be all manufacturers] have access to the latest manufacturing technology through promotion, networking, collaboration and advocacy” [my italics]. These four words are relevant because the Vernier Society’s purpose (or mission) strongly focuses on the first two ‘promotion’ and ‘networking’. And the Vernier Foundation is really in the advocacy business, advocating for careers in manufacturing and engineering to the next generation.

Each of these words is a noun but they can also be a verb. So, I am sure the CEO is now looking at actions as to, ‘how does AMTIL fulfil its mission statement’? What are the exciting things AMTIL can do to adapt the organisation to further deliver advancing technologies to the industry? This is a question Vernier are currently asking themselves and in early February next year, the executive members will meet to review their strategies and propose ideas of how to increase our collaboration, both within Vernier and with other industry associations? One of AMTIL’s excellent promotions is the “Australian Manufacturing Week” to be held again in Melbourne in early May 2023. Vernier through the Foundation is pleased to have been invited to participate in the event, adding an embryonic ‘Education’ focus into the advocacy armament of AMTIL mission and allowing Vernier a great promotion opportunity.

Collaboration is all about the sharing of ideas and inspirations and I am sure both the Society and the Foundation would welcome any member who wishes to participate in the Vernier Strategy meeting or increase participation in Vernier’s mission in any way!

Jack Parr Vernier Society member and Foundation Coordinator
December 2022

Ronson wins major contract for evolved Seasparrow Missile Program

Ronson Gears are delighted to confirm that we have been awarded the contract to deliver precision gears and gear assemblies for the Evolved SeaSparrow Missile (ESSM) program.

The three year full rate production contract is part of the collaboration between BAE Systems Australia and a major US Defence prime. The program consists of a consortium of up to 12 nation states including the US, Australia, Canada and Norway.

Read More

Where did the project for rejuvenating manufacturing fit into the “Jobs and Skills summit”?

Before his election, Anthony Albanese made encouraging statements about manufacturing. “We need to make more things in Australia … have advanced manufacturing … boost vital skills by investing in education and training … and supercharge productivity”. At that point I was enthusiastic; this new government will make rejuvenating manufacturing a real and successful project. But I was also cognizant of the classic stage descriptions of how many projects go.

My initial enthusiasm (I could really never have ‘wild enthusiasm’ (1) where a Labour government is involved) was boosted by the announcement of a “Jobs and Skills Summit”. I hoped this would be a strategic meeting, where a small number of skilled and knowledgeable people would thrash out a real plan for Manufacturing. A plan for long term investment in skills, training and STEM in schools. But when it was announced it would have 100 delegates and last but two days, ‘creeping doubt’ (2) sprang to mind. How could 100 people over two days, really tackle manufacturing’s revitalization? But doubt did not come creeping, it jumped in loudly when the Treasurer’s 14 page “Issues Paper”, released to quell the already conflicting attendant voices. did not even have the word ‘manufacturing’ in it, let alone as a major ‘issue’.

The list of delegates swelled officially to 142, and I saw my local MP Zoe Daniel (not on the list) had, not only got a seat but a speaking role, so every man and his dog had got a guernsey. But one man not worthy of an invite, it seems, was the ‘Minister for Manufacturing’ Senator Tim Ayres. His boss the ‘Minister for Industry’ was there, but according to the one real manufacturing representative, Ben Eade of ‘AuManufacturing’, the industry minister did not mention the word manufacturing at all either!

Stage 3 ‘disillusionment’ came as I witnessed a cleverly orchestrated event. The solutions were announced before the event; the government and the unions had already resolved how to solve Australia’s huge capability deficit. Were the inputs from the delegates just to be seen as cheers for the “emperor’ showing off his new clothes”? The solution was to raise wages, increase the number of women in, and diversify the workforce – it is that simple! Yes, while this is being achieved, we need to recruit the necessary skills from overseas because we are really short of nurses, (agreed), construction people and managers (definitely required if they know how to build to budget), IT people (really?), childcare workers (more men for equity balance?) and chefs (to feed the increasing workforce)! The revelation is that wage growth is held back by the weakness and confusion in the Enterprise Bargaining System! (Not the underpinning totally unrealistic Awards system itself). This was confirmed by pre-summit announcements of ‘Understanding Agreements’ made by CBA and COSBOA with the ACTU. Westmacott’s CBA, representing the ‘Big End of Town’ (and grossly overrepresented at the summit) agreeing with the Unions; Bill Shorten must be turning in his parliamentary retirement home at the irony of such an agreement!

We have truly entered stage 4 ‘descent into chaos’, if ‘multi-employer bargaining EBA’s are believed to be even part of an appropriate solution to the challenge! Real wage growth can only be driven by productivity improvements in both labour and capital. Increasing inputs through increasing female participation will increase output but that is not productivity, what has to change is the ratio. Yes, skilled migration produces efficiency but only if the mechanisms for work are more productive. Bargaining for higher wages will only produce higher costs that will be passed on in prices, further driving inflation! Productivity improvement through better skills and innovation is what feeds wage growth!

The next stages in the project progression, if you remember, are ‘punishment for the innocent’ (5), ‘search for the guilty (6)’ and ‘promotion for the non-participants (7)’. Will Manufacturing be punished? Probably no more than they are now! The increase in Tafe places may be appropriate for chefs and hairdressers but it is well accepted that Tafes cannot cater to the skills and future needs of the manufacturing industry! Maybe the newish ‘Tech Centre’s can but not without substantial investment in the latest technologies and people but these good people are zealously held on to by companies themselves. The industry can keep on investing in automation, particularly while money is so cheap. But what of the long term vision and growth? Another ‘innocent’ in all this is STEM in schools! Our national proficiency in Science and Mathematics is falling further behind the OECD countries but is this recognized? It seems more important to teach diversity than literacy in Victoria!

Why am I writing this? It is definitely GOMS – “grumpy old man syndrome. I hope it is amusing but it is more than that. It is still the passionate belief in innovation as a driver for manufacturing; in the conviction that manufacturing things through skills, ingenuity, drive and collaboration are essential to future prosperity. It is also a call to arms! The members of the Vernier Society over the last 80 years were convinced of that.

— Written by Jack Parr and moderated by the Vernier Committee

Wasted Capital in Major Project Development.

Pearls and Irritations

Dr JOHN WHITE, PETER FARLEY, DAVID GILLETT, CHRIS STOLTZ.

The establishment of the Australian Public Service (APS) Review Panel is a powerful opportunity to examine the state of play of project development at the federal government level and kick-start a positive step change in performance. This will apply pressure to state governments and business to achieve similar step changes in performance.

The inability to shape, define and build sound business cases on which to base project investment decisions, and then execute projects in accordance with the time cost quality and functionality set out in the approved and documented business case, is an endemic problem in Australia across business and government.

Research (by PwC and others) has shown that business has wasted hundreds of billions of dollars in capital project development and that 70% of capital projects fail in terms of cost, schedule or functionality (or all three).

Read the full article

A recent demonstration of the frailty of coal dominated electricity grids

On the 25th of May at 1:45pm  Queensland Coal and gas were generating about 5,300 MW out of a total of 7,500 MW. Then Unit 2 at Callide C exploded taking 400 MW of generation off the Queensland grid. Immediately its twin also disconnected, whether due to damage or safety reasons is not clear.  However the total loss was still only 800 MW or just over 10% of Queensland supply at the time. Over the next few minutes Queensland swapped from exporting about 400 MW to importing 200 MW so theoretically recovereing 2/3rds of the lost generation

However twenty minutes later another nearby unit, in a different building went offline, together with a transmission line and at least another 7 coal and gas generators. Then due to lack of inertia, wind and solar plants in North Queensland were immediately limited to 50% of peak (not actual) output. This resulted in 400,000 customers temporarily losing power.  According to some expert observers AEMO did a sterling job preventing the state going black. Probably having learnt some lessons from SA.

Now although Queensland has 12.8 GW of dispatchable capacity of which probably 11 GW was available after allowing for the first Callide outage and maintenance, it ramps up so slowly that it could not meet 4.6 GW of net demand (after allowing for wind and solar generation and swap from exports to imports at the time). In fact the coal plant disruption effectively managed to drive half the wind and solar offline as well.

Since recovery, spot power prices have remained high, averaging $296/MWh in the 21 days since the incident. At the same time last year they were averaging $39. Almost every evening QLD prices have peaked to between $2,500 and $14,000.  These price effects spread throughout the grid as Queensland exported less and imported more power, although still remaining a net exporter, For example NSW has averaged $196/MWh so far in June vs $48 last June even though renewable output is up significantly. Victoria is up from $48 to $65

Contrast the fallout from this event with the relatively mild effects of the flood at Yallourn in Victoria. Yallourn output on last Saturday at 2PM was about 700 MW which was then ramped down to 200MW as the threat of a mine flood became apparent. That was 14% of Victoria’s fossil fuel generation or about 10% of total generation at the time. It also corresponded to a period of very low wind. Yet there were no blackouts and prices only moved up briefly. Since then average prices only reaching $100 and peak prices rarely went above $300 in spite of still, overcast conditions and continuing lack of output from Yallourn.

Now a key difference is that Victoria ramped down gradually instead of in two big steps so one would have expected a more benign response. However Queensland has only been running its remaining 6.6 GW of coal and 1.2GW of base load gas plants at 65% and 45% of capacity respectively, with maximum coal output of 4.9 GW. Seven of its 22 coal generators have been offline for at least the last week, so either the remaining coal plants are off line for service and are nowhere near the 24/7 availability that their proponents claim, and therefore can’t be brought online or, the owners are withdrawing capacity from the market to force prices up. Such behaviour is more difficult in Victoria because renewables supply (30%) almost double Queensland’s share of 18% and Victoria has a theoretical maximum import capacity of about 2,600 MW vs Queensland’s 450 MW. 

If Queensland had followed SA and Victorian practice of installing batteries, somewhere between 300 and 600 MW of batteries would have supplied sufficient reserves to limit voltage and frequency instability so the second trip would almost certainly not have happened. This week, with 7 coal units offline and wind and solar still limited, Queensland manages to export power every day. Therefore it has plenty of capacity to recharge batteries and pumped hydro to meet the evening peak without requiring huge jumps in prices. Even if batteries had only reduced the jump in spot prices by one third and spot prices only account for 15% of Queensland power trade, sufficient batteries would have saved Queensland and NSW customers $60-100m in the last three weeks, not including the costs of the blackouts. Almost every day they would reduce peak prices and improve the operating efficiency of remaining coal and gas by absorbing power when demand is low and releasing it when demand is high. Alternatively, additional coal and gas plants would only add to the surplus capacity and do little or nothing to improve grid reliability in a case such as this.

The superiority of renewables/gas /storage has been clearly demonstrated in SA where prices this financial year are down 62% since the peak year in 18/19, whereas NSW is only down about 20%. The SA renewable/gas grid is not only cheaper to run but has at least twice survived generation/transmission losses of 30%+ of load, a feat totally unimaginable in Queensland or NSW.

It is not as though Queensland has not had warnings, on 9th of October 2019 Kogan Creek coal power plant tripped and caused small blackouts in southern Queensland and NSW. On 25th of August 2018 a lightning strike on the 800 MW inter-connector between NSW and Queensland caused short localised blackouts in Queensland, NSW and Victoria, and almost caused the entire NSW system to go black.

A system black in NSW in the middle of the grid is a far more serious issue than the last one in SA. It could quite easily have cascaded into Victoria and because of NSW reliance on coal, it would not have recovered in 6 hours like most of SA, it would have taken days and maybe weeks. The Texas power authorities estimated that it would have taken months if their system had gone offline in February to bring everyone back and Texas has a far more flexible generating fleet than NSW.

In conclusion, both reliability and economic competitiveness of coal fired power stations has been vastly exaggerated by their proponents and even if there were no such consideration as pollution, water use etc. a renewable grid backed by gas and storage is a a far more reliable and economical system at today’s state of the technology. 

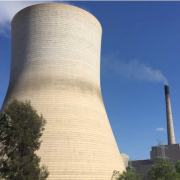
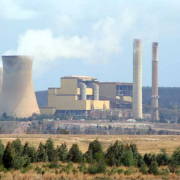
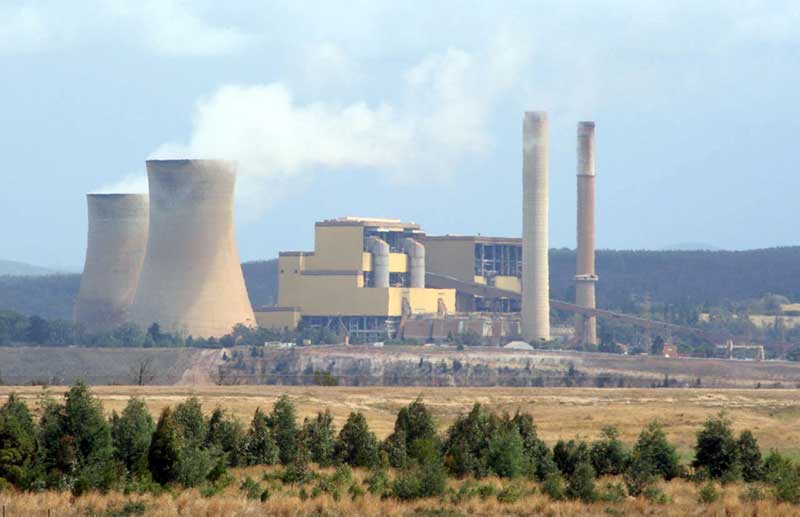
Victoria won’t run out of power when Yallourn closes

After seeing all the commentary about the risks of power shortages when Yallourn closes, let’s examine the numbers.

Victoria and South Australia currently have a significant excess power generation capacity. In the last six months Victoria’s net exports were 2,300 GWh, roughly 40% the output of Yallourn while its gas plants only ran at 5% capacity for the period. SA also is a net exporter and it has 3,400 MW of dispatchable capacity, which lately has not exceeded 2,100 MW.

At the same time SA and Tasmania are adding wind, solar and battery capacity so even after some closures, their gas plants will still be only running at about 15% capacity in 2021/22. Thus, if there was a shortage in Victoria, SA and Tasmania could easily change the import export balance with Victoria by 4,000-6,000 GWh per year without unduly stressing the existing interconnections. To be clear, changes in export/import balance alone could almost replace Yallourn’s annual output.

In addition Victoria is installing about 50 MW of rooftop solar per month so by the end of 2028, behind the meter generation will increase by about 4,500 to 5,000 GWh per year 40% of Yallourn’s output. Victoria has so much spare capacity in its gas plants that this new rooftop solar combined with running the gas plants at 50% capacity would entirely replace the output of Yallourn.

But more importantly Victoria also has 2,400MW of large scale wind and solar due on stream over the next two years. That alone will supply about 75% of the output of Yallourn. Continuing installations at that rate for 8 years would displace Loy Yang A as well

By 2028 if Victoria continues its current rate of large scale solar and wind installations and ran its gas plants at only 35% capacity, not only will all of Yallourn be replaced, it could probably close Loy Yang A and B as well.

When Minister Taylor speaks of system stability he is presumably talking about peak demand, which in Victoria is about 9,100 MW. A focus on energy efficiency and flexible demand could reduce that to less than 8,000 MW by 2028. If we were as efficient as Italy is today, peak demand would not exceed 6,000 MW.  After Yallourn closes we still have 7,700 MW of coal, hydro, gas, diesel and landfill. There will also be import capacity of 700 MW from SA, 450 MW from Tasmania and 1,500 MW from NSW even if none of the proposed transmission upgrades are built. In other words total supply capacity of  more than 10,000 MW if no new transmission or storage is built, while wind and solar are an improbable zero.

Now there are times when wind drops to 2% of capacity and solar disappears at night but the highest Victorian grid demand recorded in recent years was 9.1 GW. At the time large scale wind and solar were contributing 1.1 GW although wind was actually unusually low for a hot day. By 2028, wind and solar output will have quadrupled, so with no new controllable demand, no new transmission and no new storage we would have a nominal capacity of 14,700 MW vs demand somewhere between 8,000 and 9,000 MW or probably significantly less. Rooftop solar is also eating away at peak demand which, this summer, was less than 8,000 MW. By 2028 there will be another 4,000 MW of rooftop solar. Now even if rooftop solar is constrained and the peak occurs late that is still at least another 1,000 MW off peak grid demand.

Then there are batteries. By 2028 Victoria will have between 2,000 and 3,000 MW and possibly much more capacity on the grid and at customers.

The net result is that during the middle of breezy very hot days by 2028 apparent demand from the grid will be between 6,000 and 7,000 MW, utility wind and solar will be supplying about 4,000-5,000 GW, hydro 1 GW (50% of capacity), batteries charging so – 500 MW. Imports from SA and Tasmania running  500 MW (45% of capacity) and the remaining 5,600 MW of coal and gas running at around 35% of capacity exporting 1,000 MW to NSW.

At 7 pm when rooftop solar is gone, grid demand might reach 7-8,000 MW, wind and hydro combined will be 4-5,000 MW, batteries 1,500 MW, Tasmania 450 MW and exports to NSW 1,500 MW enabling coal and gas to run at between 15 and 25% capacity. If Snowy II is operating and wind and solar installations continue at the current rate, it is quite possible that coal might not operate at all in Victoria during summer.

This scenario is just business as usual. If NSW reverses its historical trend and has enough capacity to become a net exporter or someone was crazy enough to build Marinus link and a matching 700 MW of wind in Tasmania or Energy Connect enables another 6,000-8,000 MW of wind/solar/storage in South Australia, then not only will all Victorian coal plants be at risk but most of NSW coal as well.

In summary the chance of Victoria running out of power in 2028 are extremely small, almost certainly less than they were in 2015.


Renewables Generation

While I am not attempting to downplay findings that sea level rise is happening faster than expected, last year was yet another equal hottest year, methane emissions are climbing etc, here are some things that are happening which are hopeful signs;

  1. Regenerative or restorative agriculture is already a major priority in China and is becoming a priority in the new Biden administration and in the EU’s Green recovery and has even been given a higher priority in the Morrison government with an office and budget for the Soils Advocate. Done well, regenerative agriculture could sequester almost as much carbon as emitted by coal generation, but we have to both reduce emissions and sequester carbon.
  2. In almost all northern hemisphere regions reforestation is accelerating, sometimes not perfectly but in more and more cases using better techniques to increase biodiversity and resilience. Since 1990 forests in Europe have increased by almost 100,0000 square km. In the US it is slightly increasing and China is expanding forest by about 70,000 square km every year
  3. Renewable generation in the US passed coal for the year; In the UK, Germany, Spain, France, Sweden, and a number of smaller countries, renewables passed all fossil fuels combined.
  4. In Australia in the last 12 months, renewables have passed brown coal and gas combined. This summer wind and solar alone have provided 24.5% of electricity, gas and brown coal combined at 22.4%. On current trends more than one third of the electricity generated in Australia this year will come from renewables and we should hit 50% renewables by H2 2024. The southern states Victoria, SA and Tasmania combined use as much electricity as NSW. They will probably achieve a combined 50% renewable share for this year, while prices in Victoria and SA have crashed. SA wholesale spot prices have fallen from $110 in the 18/19 year to $33 so far this financial year while demand has increased marginally but renewables have increased from 53% to 60% of supply. Victoria price has fallen from $109 three years ago to below $40 this financial year while renewables have increased from 20% of supply to 30%.
  5. Examination of the data in Germany, the UK, Spain and Australia shows that as the technology improves and geographic dispersion of renewables widens, the need for storage and backup falls. For example in the last 6 months minimum whole day renewable share on the NEM was 25.2% vs an average of 30.1%. In other words if we wanted to maintain 30% renewables every day for the past 6 months we would only needed storage for about 5% of average demand for one day and less than 3% of demand for three days. To cover 3% of demand for three days we would need 50 GWh of storage. If announced battery storage projects are all built they will provide 25 GWh, Snowy II averaging 60% capacity for 3 days will provide 90 GWh
  6. Renewable installations are increasing even faster than predicted even three months ago. The world is now expected to install between 150 and 190 GW of solar (some say 200 GW) and 70-90 GW of wind this year. Even at the lower figures this will generate as much electricity as Germany and France combined or three times as much as the entire Australian electricity demand.
  7. China added 48 GW of solar and 71 GW of wind last year. Installations in the last quarter were enough to meet Australia’s entire annual electricity demand. Overall renewable output in China rose by 16.6% for solar and 15.1% for wind contributing to a total 2,082 TWh from all renewables (Australia’s total demand is 235 TWh) Unfortunately Coal and gas rose by 2.5%. Overall China reached 27.3% renewable share slightly ahead of Australia on 26% and well ahead of the US on 22%. It expects to install another 140 GW of renewables this year.

In India combined wind and solar capacity reached 78 GW ( Australia is about 21 GW) and the government is pressing on with its target of 175 GW by the end of next year, although it will almost certainly fall short. Prime Minister Modi laid the foundation stone for a combined 30 GW wind and solar park in Kutch i.e. a single renewable park with double the combined current capacity of every wind and solar farm in Australia.

In Korea the Government initiated the commencement of an 8.2 GW offshore wind park, which will supply the equivalent of Victoria’s entire electricity consumption,

In the UK another 8 GW of offshore leases were approved with the aim to increase the UKs offshore wind to 30GW by 2030. Based on the productivity of latest wind turbine models, 30 GW of offshore wind will supply almost 60% of current UK electricity demand. The UK now has a development pipeline of 14 GW of batteries which combined with hydro, biomass, imports and minimum wind could supply 60% of UK night-time minimum

The Danish government was approved the largest construction project in its history- a wind island which will serve as a base for enough offshore wind to supply 125% of Denmark’s current electricity supply. The energy will be used to supply data centres, transport and heating electrification, hydrogen production and export power to Germany etc.etc.

  1. Floating solar particularly on hydro dams is becoming a thing. Covering 1-10% of a hydro dam with floating solar doubles the annual energy production of the dam with no new transmission infrastructure and reduces evaporation from the dam. The absence of shading and the cooling effect of the water increases the annual output of the solar panels by about 7-12% compared to nearby land based units
  2. Outside Australia electric vehicle sales are exploding in China and Europe. Q4 sales were more than double the same time last year even though the overall market was down. Growth has continued in January, with Norway at 81% EV, Sweden 31%,  and 21% Germany. This is in spite of a shortage of stock for the two top sellers the Tesla model 3 and Volkswagen ID3. GM has announced plans to eliminate ICE light vehicles by 2035. With new medium sized electric SUVs coming to market from Volkswagen, Nissan, Ford, Mercedes, BMW, Peugot/Citroen/Fiat, Volvo and many Chinese brands this year as well as the opening of two Tesla factories EV deliveries could grow by 3m vehicles this year. Citroen is selling a basic city EV car in Europe for €6,000 and GM is selling one in China for about US$4,500 ($5,000 with air-conditioning) . They are very basic but flying out the door as fast as they can be built. Indian electric motorbikes are now available for around A$2,000
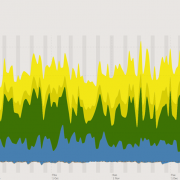
  3. Finally for those who worry about what will happen when the wind doesn’t blow and the sun don’t shine. As you can see below renewable generation on the NEM is never zero and as newer wind and solar technology become more dominant, the wind and solar curves will be smoother allowing the hydro share to be more spiky to fill many of the remaining gaps. New storage and demand response will be needed but in far smaller quantities than most people imagine.

Peter Farley

Christmas Message from Vernier

Just to cheer you up a bit, this is focused more on Australia: It is an edited extract from my end of year speech to the Victorian Vernier Society

As far as I am aware, no members of our group or their families have had significant health impacts from Covid. In some parts of the US and Europe, everyone here would know of someone who had died. If Victoria had the same death rate as New Jersey we would have had almost 14,000 people die, Belgium almost 11,000. Overall the increased health precautions seem to have saved more lives than have been lost to Covid. Only a few countries in the world can say that. The number of extra deaths in the US in the 12 months since the end of February will exceed all their deaths in WWII. No jurisdiction that I can find anywhere has recovered from a daily case load of 100 cases per million people to zero as Victoria has.

Although the economy has some way to go, particularly for our friends in the arts community and it will be changed forever, on balance it is recovering well. Employment is recovering and the manufacturing PMI has jumped back above 50 to 53, while 70% of bank customers that deferred loans have resumed payments. Early hints are suggesting that state and federal government deficits, will not be as bad as expected just 6 weeks ago.

Here are some other numbers that might cheer you up.

The second biggest company on the Australian stock Exchange is a manufacturer CSL, worth as much as ANZ and Westpac combined. Earlier in the year it was the most valuable company

In 2006 Australian liabilities to foreigners were 50% larger than Australia’s overseas assets- Today Australian ownership of overseas assets is 10-15% larger than foreigners ownership of Australian assets. Manufacturing companies such as Bluescope, CSL, Resmed, Visy, Orica, Amcor and Orora and our own ANCA and Planet Innovation, have large overseas operations – in many cases larger than their local businesses. Others such as SDI, Lovett Technologies, Cochlear, Aristocrat, Quickstep, Carbon Revolution, Resmed and many others export 90% of their products

Australian manufacturing companies have been buying back the farm, Vegemite is Australian owned for the first time ever. RM Williams, Lion beverages and Owens Illinois Glass have all returned to Australian ownership. An interesting aside is that Visy, the buyer of Owens Illinois, is trying a bit harder to gain Australian business and has recently won back from China much of the glass business for one of Australia’s biggest agricultural product bottlers. Even oil refining and transformer manufacturing although smaller than they were, are now majority Australian owned.

Local companies are investing in advanced manufacturing and Australian companies such as Vernier member H&H are building large machine tools that have never been built here before and there are now at least six Australian companies including our Spee3D building and exporting 3D printing machines using novel technologies. Even government policy has at last shown a chink of recognition that we must maintain some strategic industries, The pandemic supplies manufacturing push was a real success, Vernier members Planet Innovation and ANCA played a key part. A number of our members are reporting order intakes recently up 50% on the same period last year

On the technology front, Australian technology companies such as Atlasian, Computershare and REA world class companies and are making a significant contribution to the economy, employment and foreign income.

As for cost pressures, spot wholesale power and gas prices have more than halved from three years ago and over the next three years some of that will flow through to industrial rates. Further, the transition to renewables which we were all assured would destroy manufacturing, has progressed faster and cheaper than anyone imagined. In spite of what you might read, supply reliability has improved and costs are continuing to fall. In fact because of our vast spaces and an almost unique combination of good wind, plenty of sunshine and high peak hydro capacity, Australia should be one of the lowest cost producers in a renewable world

You all know I am an energy policy nerd. In 2014 I forecast that with supportive policy Australia could reach 24% renewable electricity this year. While the policy has been anything but supportive, we have still been been running at 30% renewables for the last 5 months and the lowest real wholesale prices for at least 10 years. Spot wholesale prices in Victoria have fallen from an average of $109 in 2018/19 to $46 so far this financial year, from 20% above NSW to 12% below. Gas was running between $9 and $12/GJ with spot peaks up to $25 it is now down to $5-6.50. The Victorian Essential Services commission has recommended lower standing offer electricity prices next year.

It now appears that investment in transmission and storage to enable a high renewable economy is far less than was envisaged even a year ago, because the combined output from new technology wind farms and solar farms is more stable and more predictable than was ever expected. Interstate power trading is actually falling down 30% since 2015 and by the end of 2022 SA will be able to run with zero gas for hours or days at a time with just one or two new large batteries and no new transmission. In my view almost all the proposed interstate transmission projects are now unnecessary and uneconomic.

Outside manufacturing, the value of farm production this year will be at a record $67 bn, about double the value of all coal output. Large foreign owned agricultural land holdings have in some cases been returned to Australian ownership. Water storages are up almost 60% on the same time last year. Water prices have fallen from a peak of $900/Ml in March to less than $200 now. For one of my horticulture mates that is about $4 million per year per $100.

In mining as we know, iron ore income is booming as is the value of almost every other commodity except coal and gas, and even those have picked up in the last week or two

You might be surprised to know that income from foreign student fees, travel and accommodation are almost double that from thermal coal. That appeared to be an imminent disaster. However at least for some universities, foreign student income has held up far better than expected as students study from their home countries and many didn’t take the advice to go home in the first place. At least two engineering schools that I know of have gained foreign students

On social policy, we have slowly started to do something about re-invigorating TAFE, making the dole almost livable, improving aged care and building more social housing while boosting spending on mental health. All long overdue moves to make life tolerable to the less fortunate among us.

And finally every cloud has a silver lining, your Christmas wine and lobster will be cheaper than last year.

In summary 2020 has turned out to be a far better year for Australia and manufacturing than anyone expected in June.

A Happy Christmas and a wonderful New Year to you all

Peter Farley

Another Good News – Renewables

1. By the end of March next year there will be only be about six major economies, Saudi Arabia, Poland, Brazil, Mexico, Russia and Australia, which do not have a net zero pledge by 2050 or 2060 in the case of China. 

2.About 150 GW of solar PV and 80 GW of wind will be installed around the world next year.. There will be about 20 GW of hydro, biomass, geothermal and solar thermal as well. Just the wind and solar is enough to supply the combined load of Germany and Switzerland or more than the total electricity generation in Australia, New Zealand and Indonesia. Every year that will increase. To put that in context, the best ever year for nuclear power installations was about 15 GW which would have supplied 1/5th of the energy that next year’s wind and solar will provide.

3. According to the International Energy Agency who have in the past been way too low in their forecasts of renewable volumes, generation from renewables will pass coal by 2025. It has already in the US, Germany, Russia, the UK, Spain, Turkey, Italy, France and Denmark, not to mention high hydro countries such as Canada, Norway, Sweden, Austria, Switzerland and Brazil.  

4. Assuming NSW REZ plan is 25% complete by mid 2025, 90% of currently financed renewable projects are completed and rooftop solar continues at its current installation rate, the NEM will be more than 55% renewables by spring 2025.

5. Spring this year is on track for 30% renewables on the NEM and the full year will crack 26%, proving my “wildly optimistic” forecast from 2014 of 24% in 2020 to be somewhat pessimistic 

5. Fortescue Metals has announced a plan to become a major wind/solar/hydrogen company building 235 GW of wind and solar around the world. Assuming a 40/60 split between wind and solar that will provide almost as much electricity as Britain, Spain and Italy combined.

6. Shell, BP and Ineos (a US$60bn per year chemical company) have all committed to large renewable powered hydrogen electrolysers. The bad news is that the market for export hydrogen from Australia is not likely to be as big as we would like if Europeans and by extension, Asia can make their own

7. The anti domestic gas coalition is growing, 40 cities in California including San Francisco have put a moratorium on connecting gas to new houses as has the Netherlands and gas free subdivisions are opening up in the ACT and Victoria. Commercial buildings with gas connections can no longer granted the highest green ratings.

8. The Halliade X wind turbine prototype produced 312 MWh in one day. That is enough to power 90 Australian households for a year or drive a fleet of Tesla Model 3 vehicles 2,600,000 km. At the Australian average of 13,000 km/ year, the annual output of one such wind turbine at an average 185MWh/day would power 43,000 EVs for a year.

650 of them would power the entire Australian road transport fleet, cars, trucks, buses the lot. This turbine is running at 13 MW. Siemens Gamesa has already announced a 14 MW machine

8. To the end of October 2018 in Germany plug-in car sales were 54,000 for the year. In October 2020 there were 48,000 for the month. Next year the Volkswagen ID 3  (Golf sized) will be at full production the ID 4 (RAV4 sized) will be available and the German Tesla factory producing Model 3 and Model Y will be up and running so it is possible that EVs will achieve 30% market share in Germany and exceed 20% for the whole of Europe by Q4 2021.

 9. During the past three weeks, in the USA seven utilities have announced plans to close or convert almost 9,500 megawatts (MW) of coal-fired generation across the U.S.* At the same time, the U.S. Energy Information Administration estimated that a record 23 gigawatts (GW) of new wind generation capacity will come online this year, shattering the previous record of 13.2 GW set in 2012.

10. At the end of 2019 there were about 600 GW of new wind and solar proposals in the queue for grid connection approval in the US and about 60 GW of gas, 2GW of nuclear and no coal. Not all of these plants will actually be built because some are competing for the same market, but there is good reason to believe that the failure rates in gas will not be much different to wind and solar. If 70% of the wind and solar plants are built, they will account for 35% of the US current electricity demand to bring renewables to a55% rate.

How Much Backup is needed for a 95% renewable NEM?

The Answer – Very Little

Examining the data from openNEM https://opennem.org.au/energy/nem/?range=1y&interval=1w in one day, three day, one week and three week periods to find the lowest renewable shares, it was possible to calculate how much renewable energy was delivered at those times. As a further check I looked at the peak demand day. Unfortunately because of the changing renewable mix and locations, looking back more than a year is not very useful, However at least as far as peak demand is concerned 31st of January 2020, was the highest demand day for 10 years.

To understand why backup is not a serious problem one needs to think about the power grid as an energy supply system rather than a power supply system. All reliable grids usually have about 30% excess power capacity. For example, in 2010 the NEM had 48GW capacity for a peak of 34GW worst demand. But grids also have excess energy capacity even at sensible capacity factors say 90% for nuclear 75% for coal 50% for gas and 15-50% for hydro. At those rates (obviously without nuclear) the NEM could have safely generated 280-300 TWh in 2010 but demand was only 210 TWh.

If a renewable system is designed to produce 280 TWh per year with 10-15 TWh from gas, then based on 14% CF for rooftop solar, 29% for tracking solar and 43% for additional wind it is possible to calculate the amount of generation required.  One possible mix is about 40-50 GW of wind 20-30 GW of utility solar and 50-70 GW of behind the meter solar. Germany with about 20% of the area available for renewables as the NEM, already has 54 GW of onshore wind and 53 GW of solar so space is not a problem. Spain with an economy about the same size as ours plans to install an additional 60 GW of utility wind and solar by 2030, we only need an additional 55 GW, so if they can afford it why can’t we.


There will also be some biomass, waste to energy, landfill gas etc. and there seems to be a small revival in solar thermal with storage around the world and possibly some geothermal. Lets say in total there might be 2 GW of dispatchable, non hydro renewables and 10 GW of existing gas. With generator upgrades and 3 or 4 smaller pumped hydro projects there will be about 11 GW of hydro/pumped hydro but no increase in annual output from hydro.

Returning to periods of low renewable supply and calculating the current renewable generation on those days and multiplying them by the capacity increase eg if there was 5% of supply from wind, it was multiplied it by 8. If utility solar supplied 3%, it was multiplied it by 9, rooftop solar by 5 and so on and on only a very few days per year did renewables not supply more than 60% of the energy. On most days, outside Tasmania, neither hydro nor gas were required at all or ran at 10-20% of capacity for 1-4 hours

On the worst days I used Anero.id https://anero.id/energy/2020/May/5 to check the 5 minute minima and I found that even running 11 GW of hydro and 10 GW of gas and 2 GW of other at 85% there are still gaps. There is still a need for backup, however the periods are quite short. The worst case I could see was about 15 GW for 30 mins trailing off to zero in around 12 hours. Other longer lower production periods would need to run gas and hydro for perhaps 70% of the time ranging from 10-90% capacity but need little additional backup. Put a different way, the longer the period considered, the the closer to average the renewable output will be, so the less long term backup will be needed. By illustration the worst renewable hour was 9% of supply, the worst day was only 17.3% of supply, the worst renewable week 20% and the worst renewable month 22%, the annual average was 25%

There are many forms this backup can take, grid batteries almost being the last in the queue, although they do have fantastic advantages in frequency and voltage control. The cheapest backup is flexible demand. Even on the hottest day at least between 10 and 2 there will be excess solar, so a smart grid will use the excess to run hot water heaters, move municipal water around, make ice or freeze phase change materials in cool stores, precool residences etc, to drive down evening demand. I am not a great fan of home batteries but many customers are and it is quite likely that most of them will be linked into Virtual Power Plants. In the US attachment rates for batteries on home solar are running around 30%. In 10-15 years time we will have 5-7m behind the meter solar systems. if only 1/3rd of them have batteries which can only contribute 2.5 kW for 4 hours, mostly by self consumption but also by feeding excess power back to the grid. That is around 5 GW reduction in grid load.

Initially I was opposed to batteries at generators because for a whole variety of reasons, storage near the load is more effective. It reduces grid losses by reducing peak transmission loads and eventually the need for expensive upgrades to Transmission &Distribution assets. It also protects against transmission as well as generation failure.

However grid management and price stability is much easier if most wind and solar farms have some sort of storage, not necessarily a large capacity, even 10% of the peak capacity for 30 minutes,  can improve managability and profitability of a wind or solar farm, while simplifying grid access. (see Dalrymple in SA)


If current trends hold, in 5 years time a wind farm will cost about $1.6m/MW to build and 3 hour storage about $0.5m/MW so adding 15% storage to a wind or solar farm will only increase costs by about 5-10%, By avoiding curtailment and selling some power at evening spot price at say 3 times day minimum it is not hard for batteries to pay for themselves. If the above forecast of capacity is correct, then when wind and solar are fully built out and 70% of facilities have 15% storage attached (hydrogen, pumped hydro, batteries, power to heat for nearby industry, whatever) that is about 7 GW peak capacity so combined with gas, hydro, customer batteries and flexible demand there should be adequate capacity 24/7/365.

Smart charging of EVs will also be a big part of the solution and even some V2G (Vehicle to Grid) on 5-10 days a year. Most cars only need to be charged off a single phase home or work charger for about 8 hours a week (20-50KWh = 170-450km/week) and on average at full charge carry a weeks worth of energy. So in an emergency it is easy to limit charging for 4-5 hours to perhaps 2-3% of vehicles. The rest of the time they can soak up excess wind and solar. While EV penetration is contentious, next year in Europe EV share is expected to be around 20% so by 2030 probably 75-80%. That would mean by 2030 almost half the vehicles on the road would be electric or plug in hybrid. Lets say in Australia it is only 15% (3m) and of those 20% are capable of supplying V2G and at any time half of those in turn are plugged in (i.e. 350,000 or 1.6% of registered vehicles) and make half of of their battery capacity available, that is another 2 GW/20GWh.

There are many ifs and buts in this scenario but I have been studying this in detail for seven years and so far my predictions of renewable penetration have turned out to be underestimates. In 2014 I assumed supportive government policy and underestimated the difficulties in grid connections, bankruptcies of contractors etc. But I forecast, (accoding to others, an unbelievably optimistic) 24% renewables for the year 2020 including 12 TWh of solar. This year the NEM will actually hit 26% renewables and probably 19 TWh of solar. This is despite this year being cloudier than last year and therefore renewable capacity factors are down. Even if next year weather isn’t any better, there is enough capacity being installed to increase renewable share by another 6% to 32%.


On the other hand there is a huge amount of development work being spent on smarter solar trackers, special coatings for panels etc – not to increase peak power but to improve efficiency on cloudy days and early and late in the day. Similarly new wind turbines are being optimised to generate power at lower and lower speeds, so that rather than put a 4.5 MW generator behind a 126 m rotor on 90m tower for less money you can put a 3.5MW generator on a 130m tower with a 155 m rotor. The taller tower and larger rotor will catch more and faster wind, so will probably generate just as many MWh per year, but most importantly will be generating twice as much power when the winds are light so it needs less backup. Thus the system cost is lower. My calculations above do not include any such advanced technologicalsolutions.


To summarise the short term storage, 1-12 hours will either be installed by economic actors or, like the Victorian Big Battery, to obviate the need for much more expensive transmission upgrades. One interesting example is that transmission upgrade required to make Snowy II useful to Victoria could be completely eliminated by about 4 of these batteries for about half the cost.


As an aside, in practical terms the whole Snowy II project including transmission and extra generation to make up for the pumped hydro losses will cost $8-10 bn and cause significant environmental damage. Based on the costs of the latest large scale battery projects, 3 GW eight hours (2GW x12 hours) of batteries distributed thoughout the grid would provide more practical support, reduce system losses and bushfire threats and cost about $5-6bn


In summary a 95% renewable grid needs little to no storage that won’t be installed by generators and customers for their own economic reasons. For longer term backup we already have hydro and gas.

——————————
Peter Farley FIE Aust
——————————

Another View of Energy Transition

If we can’t prosper in our sparsely populated, vast, resources rich continent, blessed with sun and wind (not to mention uranium), and practical, intelligent people – we’ll have to hang our heads down in shame before our grandchildren.

But we’ll have to cast off our colonial cringe that subjugates us to almost anything foreign, even a French submarine, at four-times the 1st world benchmark price with all manufactured parts imported from France, and the same story for the British designed frigates and German designed offshore patrol vessels.

And we need to shed the Thatcherism-like religion that we can’t manufacture cost effectively in Australia and we should just be a services driven economy, circulating the earnings from the mining/agriculture exports, with the view that the market is best placed to deliver (long-term) infrastructure.

For example, let’s find a solution to reliability of renewable electricity supply without using (imported) batteries that consume rare resources and pollute the environment on disposal – it’s not rocket science.

We also need to recognise the massive opportunity to regenerate our vast degraded agricultural lands (especially the few hundred million hectares of rangelands), as Minister Taylor has in including soil carbon measurement (by remote sensing) in his five priority low emissions technologies.

This can not only transition Australia to a net negative emission economy by 2050 (with sufficient surplus carbon credits to staple to our exports with embedded carbon emissions, eg, LNG, coking coal, aluminium), but also improve the productivity and health of the agricultural lands, whilst improving bio-diversity and human health, and avoiding environmental damage (eg, chemical nutrient runoff to riparian systems and estuaries/reefs, erosion, etc).

But is our National Leadership capable of the transition, when we can’t break the pattern of practically all Government approved infrastructure spending being based on the self-interested political efficacies of the next electoral cycle?

I don’t expect large corporates in Australia will provide the leadership, as many are foreign owned and are here as rent-seekers harvesting the spoils of our couple of decades of poorly implemented privatisation experiment.

I suspect we will have to learn to live with COVID, which may keep the community’s focus on more self-reliance and a healthier more diverse environment, and drive our self-interested political class to broaden their vison.  Who would have expected “ScMo from marketing”, ‘with a lump of coal in hand’, to come up with the Modern Manufacturing Strategy (MMS).

What an opportunity he now has – to cancel the French submarines and British frigates, avoiding a quarter trillion dollars flowing to France and Britain over the next 40 years – lock-in a process to get suitable submarines and frigates designed and built in Australia, at one-third the cost with over 70% Australian industry content (as per Collins subs and ANZAC frigates) – and commit the surplus $200 billion to the sorts of programs Peter set ourt in his email below and I mention above.

Continuing the Energy Transition Discussion

From my point of view climate change is almost irrelevant to the energy debate at this point. The bids being received in India for example, for wind and solar are lower than the operating costs of existing coal plants. In parts of the US and Europe wind is half the cost of running a coal plant.  One of the large Indian conglomerates is proposing the the government enforces the closure of 40 GW of old coal plants which have failed time and again to meet pollution deadlines. Many of these “old” plants are newer and more efficient than most Australian plants.  The closure call is partly to reduce pollution but partly to reduce overcapacity which is making everyone lose money and partly to reduce water stress – a coal power plant uses as much water as a town of 400,000 people. The coal plants in India are only running at about 55% capacity so a few closures wouldn’t risk energy security

A similar situation is occurring in the US, Germany Spain and the UK. Now the gas peak has long passed in the UK and Spain and some US states and Germany. There are some new gas plants on order in Asia and the USA but even before Covid all the Gas power plant manufacturers were laying off 10’s of thousands of staff.  In the last 2 years 18 GW of gas fired generation capacity was installed and about 320 GW of wind and solar.

Then there is transport. With the closure of yet another refinery and the other three on the brink we face a cascading failure like the car industry. As EVs now have a lower lifetime cost of ownership than equivalent petrol cars, wouldn’t we be far better off to subsidise EV purchases than subsidise refineries and continuing to import fuel?  Although at this juncture because of Morrison’s and Taylor’s absolute failure we may have to do both. By the way Angus Taylor’s nickname has gradually morphed from Anxious Failure to AnGas to Absolute Failure now that refineries are closing and fuel security is supposedly enhanced by leasing fuel on the other side of the world

We have an even more urgent problem than coal and gas, in bulk grains. Last year France exported more wheat than we did and Russia more than twice as much. Russia has enough abandoned farmland, 200m hectares, that even at half its current wheat yield could still provide about 5 times as much grain as we grow. Russia is getting warmer and more hospitable to grain growing while our wheat country is getting dryer and less productive.

One final threat that we might be forced to consider after Tuesday. A very effective counter China strategy is a border adjustment tax, that penalises countries exports that have high embedded emissions like China does. This is being planned already in Europe, if the US joins in, it is on. Guess which country has the most CO2 intensive economy outside the Middle East, even worse than the USA and will get whacked in such a scenario (good old OZ).

So whether we take action because of climate change or because our energy markets are going to disappear sooner rather than later, or for domestic energy security, or even for climate change reasons, it is not important. The fact is that the cheapest fastest way to solve all these problems is to bring on the energy transition here as fast as possible. Imposing a carbon tax on exports particularly of LNG would be a good start.